
ANONYMISED HISTORICAL CASE ACCOUNT
Turning a Loss-Making Café Back to Profit in 90 Days
A two-year-old independent café was busy but bleeding cash. Wages were consuming 42% of sales, three suppliers were overpriced against market, and the menu was drifting toward low-margin items.
Busy is not the same as profitable — structure decides both.
Historical anonymised case account: figures and reported outcomes originate from earlier first-party materials; independent verification of each number has not been established by this publication.
Independent UK Café — Established 2023
South West England
90 days (audit → stabilisation)
November 2025
Turnaround and margin
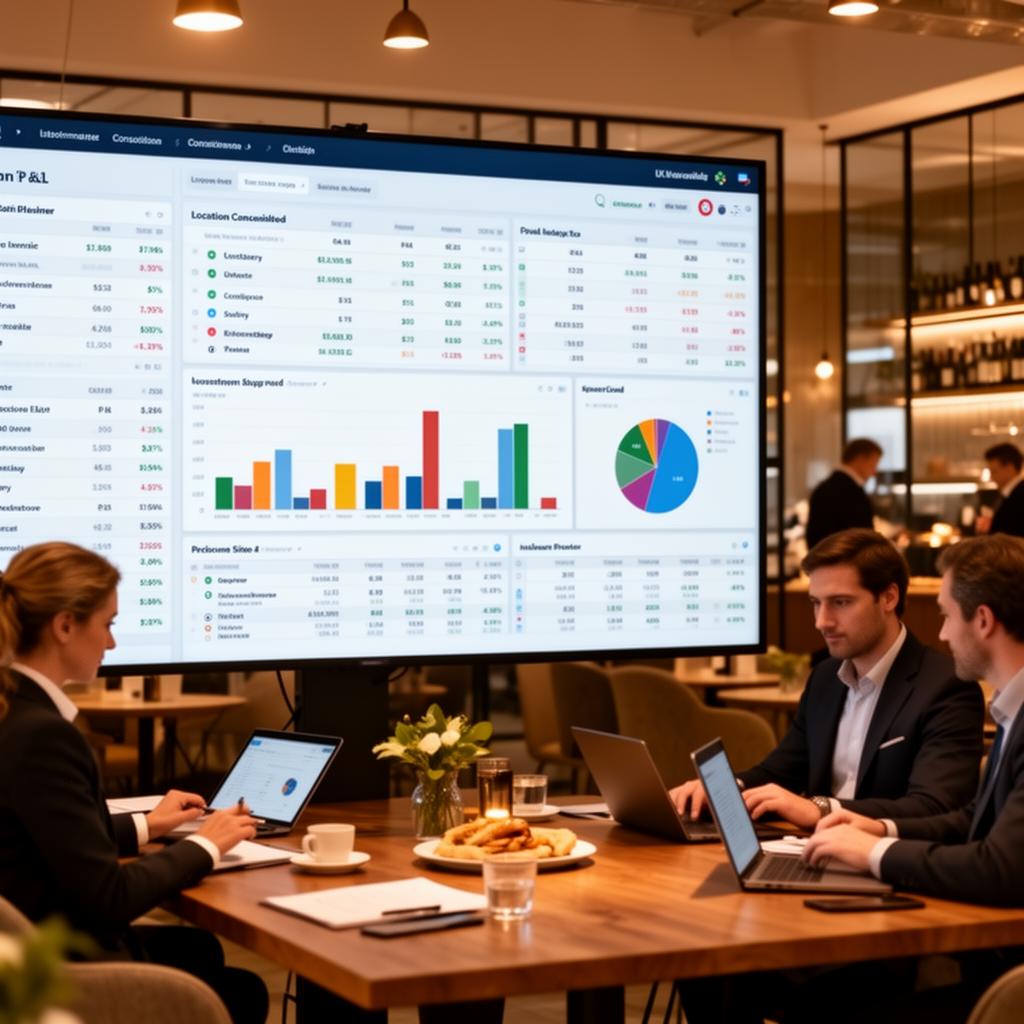
Editorial illustrations · Not photographs of the anonymous client's venue

Deep operational analysis
Behind the decisions: what matters commercially
The historical account describes a café with a recurring operating loss, high paid hours and supplier costs that did not fit its menu prices. The publication should allow operators to understand how a turnaround diagnosis works while keeping the spectacular profit result clearly labelled as unverified.
90-day profitability turnaround narrative — reported financial results not audited. The analysis below explains practical decisions and evidence standards; it should not be mistaken for new client records.
Decision 01
Establish cash and accounting truth first
What the historical account describes
The old narrative reports a £4,800 monthly loss, wage cost of 42% of sales and high supplier prices.
The practical evaluation
Start with bank reconciliation, VAT treatment, refunds, daily till takings and a consistent P&L definition. Decide whether owner salary, finance costs and one-off fit-out costs are included before calling a month profitable or loss-making.
Records that would verify it: Reconciled monthly management accounts, wage journals and direct-cost ledger.
Decision 02
Identify the wage schedule mismatch
What the historical account describes
The archive says overlapping barista coverage did not align with demand.
The practical evaluation
Plot paid hours and net takings by shift, then simulate an alternative rota under actual minimum staffing, breaks, service-level and contractual constraints. Labour percentage can fall because sales rise, hours fall or both; document which.
Records that would verify it: Payroll, rotas, POS hours, compliance checks and hourly transactions.
Decision 03
Retender the right suppliers
What the historical account describes
The case refers to 15–25% above-market pricing in selected categories and re-tendering across purchasing lines.
The practical evaluation
Compare milk, pastries, packaging and cleaning on delivered like-for-like price, VAT, minimum order, waste and quality. Change one variable at a time where practical and log actual credit notes or revised invoices.
Records that would verify it: Before/after invoices with equal pack units, supplier correspondence and waste records.
Decision 04
Rebuild the menu contribution mix
What the historical account describes
The narrative describes menu repricing over high-volume items and moving low-contribution items out of prominent spots.
The practical evaluation
Identify high-frequency drinks whose ingredient or labour cost changed, run scenarios for recipe changes versus price rises, and test customers' responses after implementation. Gross margin and retained cash are different measures.
Records that would verify it: Versioned menu prices, recipe sheets and product-mix change reports.
Decision 05
Prove whether the turnaround actually held
What the historical account describes
The source says the site later generated profit, improved margins and reduced owner hours.
The practical evaluation
Use a month-by-month bridge from baseline loss to realised profit; separate seasonality, pricing, staffing, supplier effect and exceptional items. Annualising one exceptional month as a permanent benefit is not the same as a full-year result.
Records that would verify it: Three or more months of matched post-change P&L, bank evidence, owner timesheets and independent lender confirmation where claimed.
How to run a comparable engagement
The sequence below is a professional review framework informed by the scenario, not a confirmed reconstruction of meetings or deliverables from the anonymous client's engagement.
01 · Days 1–14
Diagnose true cash leakage
Useful output: Reconciled baseline, rota/load map and supplier price comparisons
02 · Days 15–45
Test high-leverage interventions
Useful output: Approved labour, menu and purchasing changes
03 · Days 46–90
Monitor contribution and working capital
Useful output: Weekly cash dashboard, monthly P&L bridge and owner handover
Owner's due-diligence checklist
- Is the profit number gross profit, operating profit or net profit after owner wages?
- Do the claimed baseline and end month use the same accounting rules?
- Does the £58K 'annualised swing' accurately describe repeated improvement?
- What part of the change was driven by sales, menu, wages or suppliers?
- Is the refinancing claim supported by lender documentation?
Useful external guidance and documented comparisons
- How Matcha: inherited operating problems in practice ↗
A separate firsthand case about due diligence, supplier changes and service routines
Preserved original case narrative
What the earlier project summary reported
The text below records earlier first-party claims, not independently verified client testimony. Important numerical and financing assertions require the original underlying records.
The operator inherited the site 18 months earlier and had never seen a profitable month. Sales were healthy — the café was consistently busy from open to 2pm — but the P&L showed a £4,800 monthly loss and the overdraft was maxed. The instinct was to raise prices; the diagnosis showed the problem lay elsewhere.
A two-week operational audit identified three fixable issues. First, the rota was built around staff availability rather than demand: three baristas overlapped for a 90-minute mid-morning window when demand supported two. Second, milk, pastries, and cleaning supplies were 15–25% above market rate — a legacy of never re-tendering suppliers. Third, two of the three highest-selling drinks were the lowest-margin on the menu, unpriced against a 15% supplier cost rise from the previous year.
The fix ran in three phases. Weeks 1–3: rota rebuild against 30-minute demand blocks and supplier re-tender across five categories. Weeks 4–6: menu repricing on eight high-volume items, with two low-margin items relegated from the front of the menu. Weeks 7–12: weekly P&L rhythm with the operator, tracking wage %, gross margin, and cash headroom.
By week 10 the site was breaking even. By week 12 it cleared £3,900 of net profit — a £58,000 annualised swing on the same footfall. The owner refinanced on stronger terms three months later and now runs the weekly P&L rhythm independently.
Starting position reported
- Wage cost at 42% of sales
- Three suppliers 15–25% above market
- Menu drift toward low-margin items
- No weekly financial rhythm
- £4,800 monthly operating loss
Actions or changes reported
- Wage cost reduced to 31% of sales
- Supplier base consolidated and repriced
- High-margin items pushed to bestseller slots
- Weekly P&L rhythm established
- Consistent monthly profit within 12 weeks
Historical claims (unverified)
- £58K annualised profit swing
- Wage cost down 11 percentage points
- Blended gross margin up 6 points
- Owner working 15 fewer hours per week
- Site refinanced on stronger terms
Source-based project timeline
What the records actually establish
Dated internal records and external sources are distinguished below. An independent listing can verify the venue, but does not independently verify consulting outcomes or imply client approval.
Historical record — first-party only
This archived, anonymised narrative contains figures and statements from an earlier Pearl Lemon case summary. The original client-level records and independent calculations are not confirmed by this publication; it should not be used as a verified performance benchmark.
Documented comparison — not independent proof
See the linked first-person project for an example of the practical operating decisions described here. Its evidence does not substantiate this separate anonymous case's performance claims.
View source: Related documented Pearl Lemon experience ↗
What a prospective café owner should ask
What evidence would substantiate a 90-day return to profit?
A dated baseline and comparison profit-and-loss statement, transaction reports, staff costs, supplier invoices and owner-approved calculation of the annualised figure. These have not been independently confirmed for this archived example.
How can you distinguish operations changes from financial claims?
Identify changes to rotas, recipes, supplier contracts and service workflow separately. Do not treat sales or profit forecasts as realised gains without reconciled numbers.